To better identify the long-term phases of the market Market Miracle Advisor provides information that allows you to understand the attitude on the asset by institutional investors and professional investors.
For a better understanding it is appropriate to know that the position of the Institutions on the market is calculated every month, that of the professional investors every week.
Knowing the periodicity of the calculation of the two most important operators of the market we can identify the phases that last :
In this way every trader can, in base to its propensity to the risk, have one information in more on when to consider a signal for its analysis and eventual operativity.
Of continuation a concrete example taking an old diagram of BPER BANCA in which all the phases are obvious in order to identify them.
In this case the market phase is identified for institutional investors but the logic is the same for professional investors, with the only difference that for professionals the phase changes more frequently.
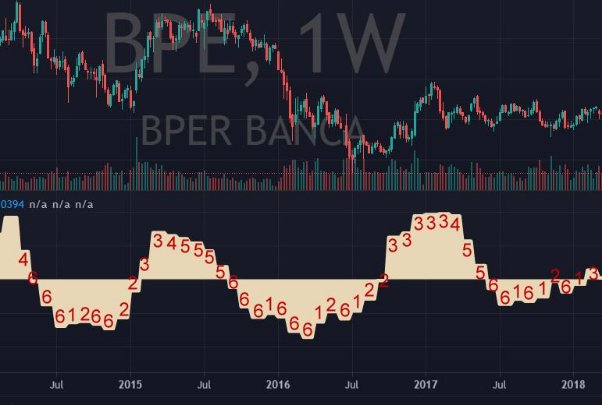
The phase reported by Market Miracle corresponds to the small number that has been placed next to each month's value of the net LONG / SHORT position of the player Government, Institutions, Banks & Funds i.e. institutional investors.
Institutions have a net SHORT position with respect to the analysed asset, in the previous period their SHORT position was even more SHORT than in the current period.
Institutions have a net SHORT position relative to the asset being analysed, in the previous 2 periods their SHORT position was higher than it is now.
Institutions have a LONG net position relative to the asset being analysed, in the 2 previous periods their position was less LONG than it is now.
Institutions have a net LONG position in relation to the analysed asset, but have reduced their LONG position compared to the previous period.
Institutional investors have a net LONG position in relation to the asset being analysed, but have reduced their LONG position compared to the previous two periods.
Institutions have a net SHORT position against the analysed asset, and have increased their SHORT position compared to the previous period.
In descending order of riskiness to take a position these are the phases : ( 6 is the most risky ) 6, 1, 2, 5, 4, 3
Obviously to greater risk could also correspond a greater profit, for which this information must necessarily be considered on the signals in order to select eventual suitable entries to the own propensity to the risk.
In synthesis :
At this link you will find a video explaining market phases and their use https://www.youtube.com/watch?v=Ugr-PHq63g0.
For more information on this category and the logic behind it, see page describing the Miracle viewer indicator.
We also recommend reading the Market Miracle Advisor manual and the FAQ FAQ - Answers to frequently asked questions