
Miracle Viewer is a technical indicator developed by Bruschi Tiziano. The purpose of this indicator is to identify the "Net short" / "Net long" position of the various players in the market.
Miracle Viewer provides an approximate but representative view of the sentiment of the various market players and is able to identify how the following categories of investors are trading at any given time.

by generating a graph for each ticker that looks like this
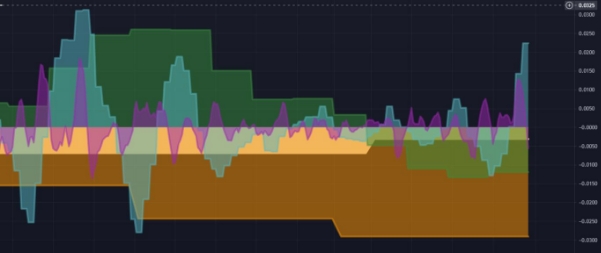
When the wave of a category is below zero it indicates that that category has an overall SHORT position with respect to the stock, above zero it has an overall LONG position.
These waves, typically cyclical, follow of the oscillatory movements and allow one projection in the future of the possible trend that could happen on the price.
The weighted summation of these waves determines the overall market trend.
The price action of an asset is determined by the market trend and by a non-calculable and predictable component which is the market sentiment.
The Miracle Viewer indicator is not downloadable from any website and cannot be purchased. However, you can use the signals and all the information it generates on this website.
On the detail page of each ticker monitored by Market Miracle Advisor you will find the chart representing the interest of the various market players on that specific asset.
View the explanation video on youtube by clicking on this link